Mapping Data with Situational Analysis
Situational analysis invites researchers to explore relationships and patterns in the data by creating visual maps as part of the analytic process. Three kinds of maps are: situational maps, social world/arena maps, and positional maps. While this approach is associated with grounded theory, it can be used with data collected using other qualitative methods. Indeed, situational analysis can be used in conjunction with other types of data analysis.
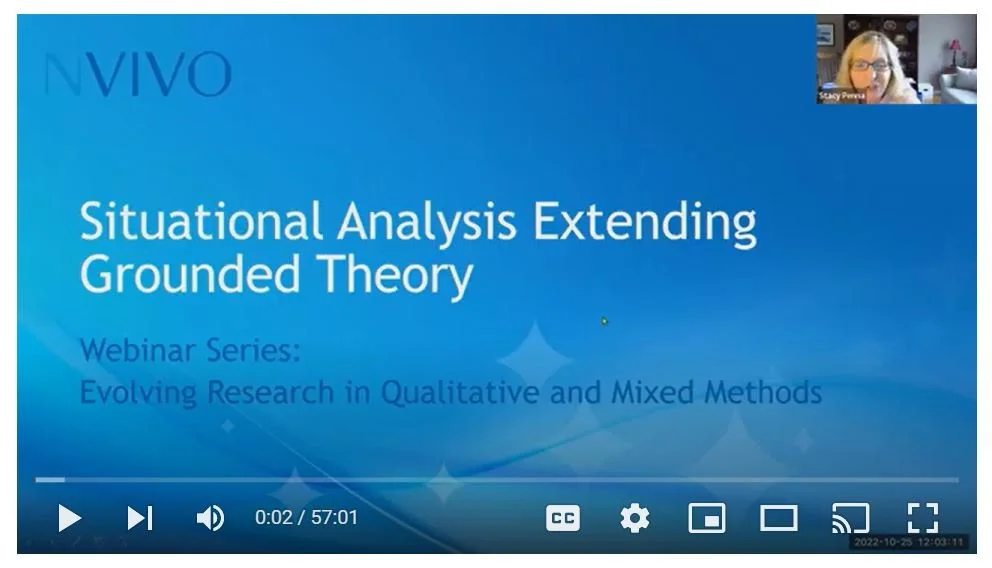
Two co-authors of of this practical and interesting book, Rachel S. Washburn and Adele Clarke, discussed situational analysis in a recorded webinar offered through NVivo and shared with permission. Log in to gain free access.

Click to access the recording.
Register for the free Lumivero Virtual Conference – September 27-28, 2023
Dive into the world of data at the free Lumivero Virtual Conference! We’re bringing researchers and Lumivero software users together to learn and connect for better insights. Whether you’re analyzing statistical or qualitative research, you’ll learn how to create outcomes that drive impactful decisions with Lumivero software: Citavi, NVivo, @RISK, DecisionTools Suite, Sonia, Tevera, and XLSTAT.
More Methodspace Posts about Qualitative Data Analysis
Interviews with this year's winners of Sage's 10-year-impact award, Elo Satu and Helvi Kyngäs.
Situational analysis invites researchers to explore relationships and patterns in the data by creating visual maps as part of the analytic process. Co-authors of the book on this analytic method presented a webinar - view it here.
Qualitative data analysis varies by methodology. Learn about approaches for phenomenological studies through this collection of open access articles.
Learn about qualitative data analysis approaches for narrative and diary research in these open access articles.
Ethnography involves the production of highly detailed accounts of how people in a social setting lead their lives, based on systematic and long-term observation of, and discussion with, those within the setting.
Qualitative data analysis varies by methodology. Discover diverse ways to analyze data for grounded theory studies in these open access articles.
Qualitative data analysis varies by methodology. Learn about approaches for action research in these open access articles.
While reflexivity is a concept quite familiar to qualitative researchers, the idea of ‘technological reflexivity’ may be less so. Find information about October 2023 events and articles.
How can you study digital culture and activism? Watch this interview with Dr. Lyndon Wray.
Look at the choices of video methods made by authors of four research articles.
This collection of open-access articles includes qualitative examples of analysis strategies to use with multimedia video data.
How do we understand and interpret visual or video data? See these open-access articles for ideas and examples.
Find a collection of open-access articles about analyzing and interpreting photos generated by participants using photovoice mmethods.
How do you analyze data in photovoice studies? Jean M. Breny, Shannon L. McMorrow offer an introduction.
The baby crying next door. Chaotic street life that permeates the apartment. Music. The tone of voices in the interview recording. Whether intentional or not, sometimes important data can be heard. How do we analyze and interpret aural data? These open-access articles offer some examples.
Learn what to do when you are faced with next steps after coding qualitative data.
How do you ensure that your analytic strategy fits the qualitative methodology and methods selected for the study? Watch this recorded presentation and learn from the explanations offered by Dr. Linda Bloomberg and Dr. Janet Boberg.
Qualitative data analysis can only get you so far - then you need to make sense of what you have found. Find open-access examples and guidance in this curated collection of articles.
Learn some important steps about using Quirkos software for qualitative data analysis.
This hands-on post introduces a tool you can use in the analytic stage of a qualitative study.
View this video for a series of short presentations about coding in qualitative research.
Charles Vanover, Paul Mihas, and Johnny Saldaña discuss their excellent book in this lively video interview.
This interview was a show-and-tell about analyzing online talk.
Are you thinking about whether to use CAQDAS, Computer Assisted Qualitative Data AnalysiS, to manage, code, and assist in the analysis of your qualitative data? Reviewing available software is a good first step, before you decide whether and how to use what technology. In this post, find resources about how to use NVivo - other software options will be considered in additional posts.
Qualitative researchers often collect large quantities of data that can include visuals or media, audio files or notes from interviews, text or artifacts. Some rely on software to organize, manage, and code data. This use of technology is described as CAQDAS, Computer Assisted Qualitative Data AnalysiS. Find resources about how to use CAQDAS in this post.
Dr. Helen Kara offers tips for the process of coding qualitative data.
Need to brush up your skills, find a book for a course or a student? Here are some options from Sage for researchers who want to analyze qualitative data.
Margaret Roller compiled collections of articles about qualitative data analysis into useful mini e-books available for open-access download.
In this webinar, Virginia Braun and Victoria Clarke, the authors of award-winning textbook Thematic Analysis: A Practical Guide, explore good practices in reporting thematic analysis (TA) - particularly for the reflexive TA approach they have developed.


Learn how inductive and deductive styles of reasoning are used to interpret qualitative research findings.