
Find a post
Big Data

A persistent challenge in qualitative research is synthesis. When you are working with large volumes of text (interviews, field reports, narrative accounts) across multiple countries and time periods, how do you move systematically from individual accounts to broader patterns? And how do you do so without flattening the complexity that makes qualitative data valuable in the first place?
This piece describes how causal mapping, combined with an AI-assisted coding workflow, helped address that challenge in a large, multi-country research and evaluation project and what researchers working with similarly complex qualitative datasets might take from the experience.

The editorial team for Sage Research Methods, Sage’s award-winning digital platform, invites proposals for its Datasets format. The successful submissions will be featured in the upcoming Inclusive Research Methodologies collection, launching in 2026.

Dr James Abdey discusses the importance of statistical literacy and applications of methodologies to assist researchers in understanding their data and presenting their results clearly, objectively, and with confidence.
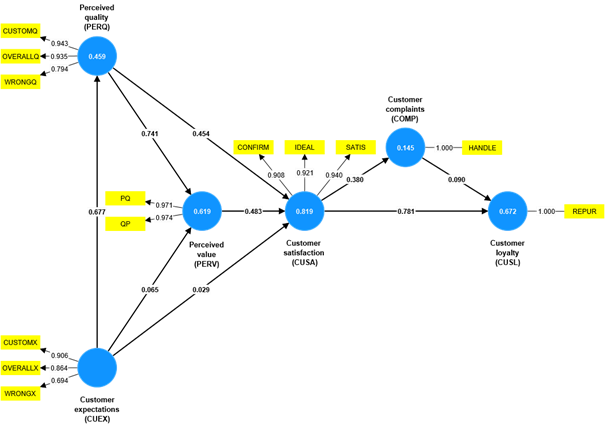
Learn about options available in the dynamic landscape of emerging methodological extensions in the PLS-SEM field is the necessary condition analysis (NCA).

An interview with authors of Social Statistics for a Diverse Society, who discuss how to use statistical techniques to understand pressing social issues.
Jump to

Sage Campus
Online learning for skills and research methods. Our 200+ hours of online courses are self-paced and instructor-led, comprising an engaging mix of Sage-quality content, video, interactives, and formative assessments.
Methods Minute Newsletter
Sign up to be the first to know about the latest news and events
Statistics

As part of our ongoing commitment to delivering high-quality online learning, we are excited to announce a series of updates to our Sage Campus courses! These enhancements are designed to support academic success by providing practical resources and empowering learners at every stage of their academic journey.

Last month Sage hosted an exclusive webinar with the JASP founder, Eric-Jan Wagenmakers, and fellow JASP creator Johnny van Doorn. Based at the University of Amsterdam, these renowned experts introduced the world of teaching statistics using JASP.
Dr James Abdey discusses the importance of statistical literacy and applications of methodologies to assist researchers in understanding their data and presenting their results clearly, objectively, and with confidence.

Listen to this interview, and check out Rhys Jones’ latest book: Statistical Literacy: A Beginner's Guide.

Find tips to help you share your research and numerical findings.

Dr. Stephen Gorard defines and explains randomness in a research context.

Mentor in Residence Stephen Gorard explains how researchers can think about predicting results.
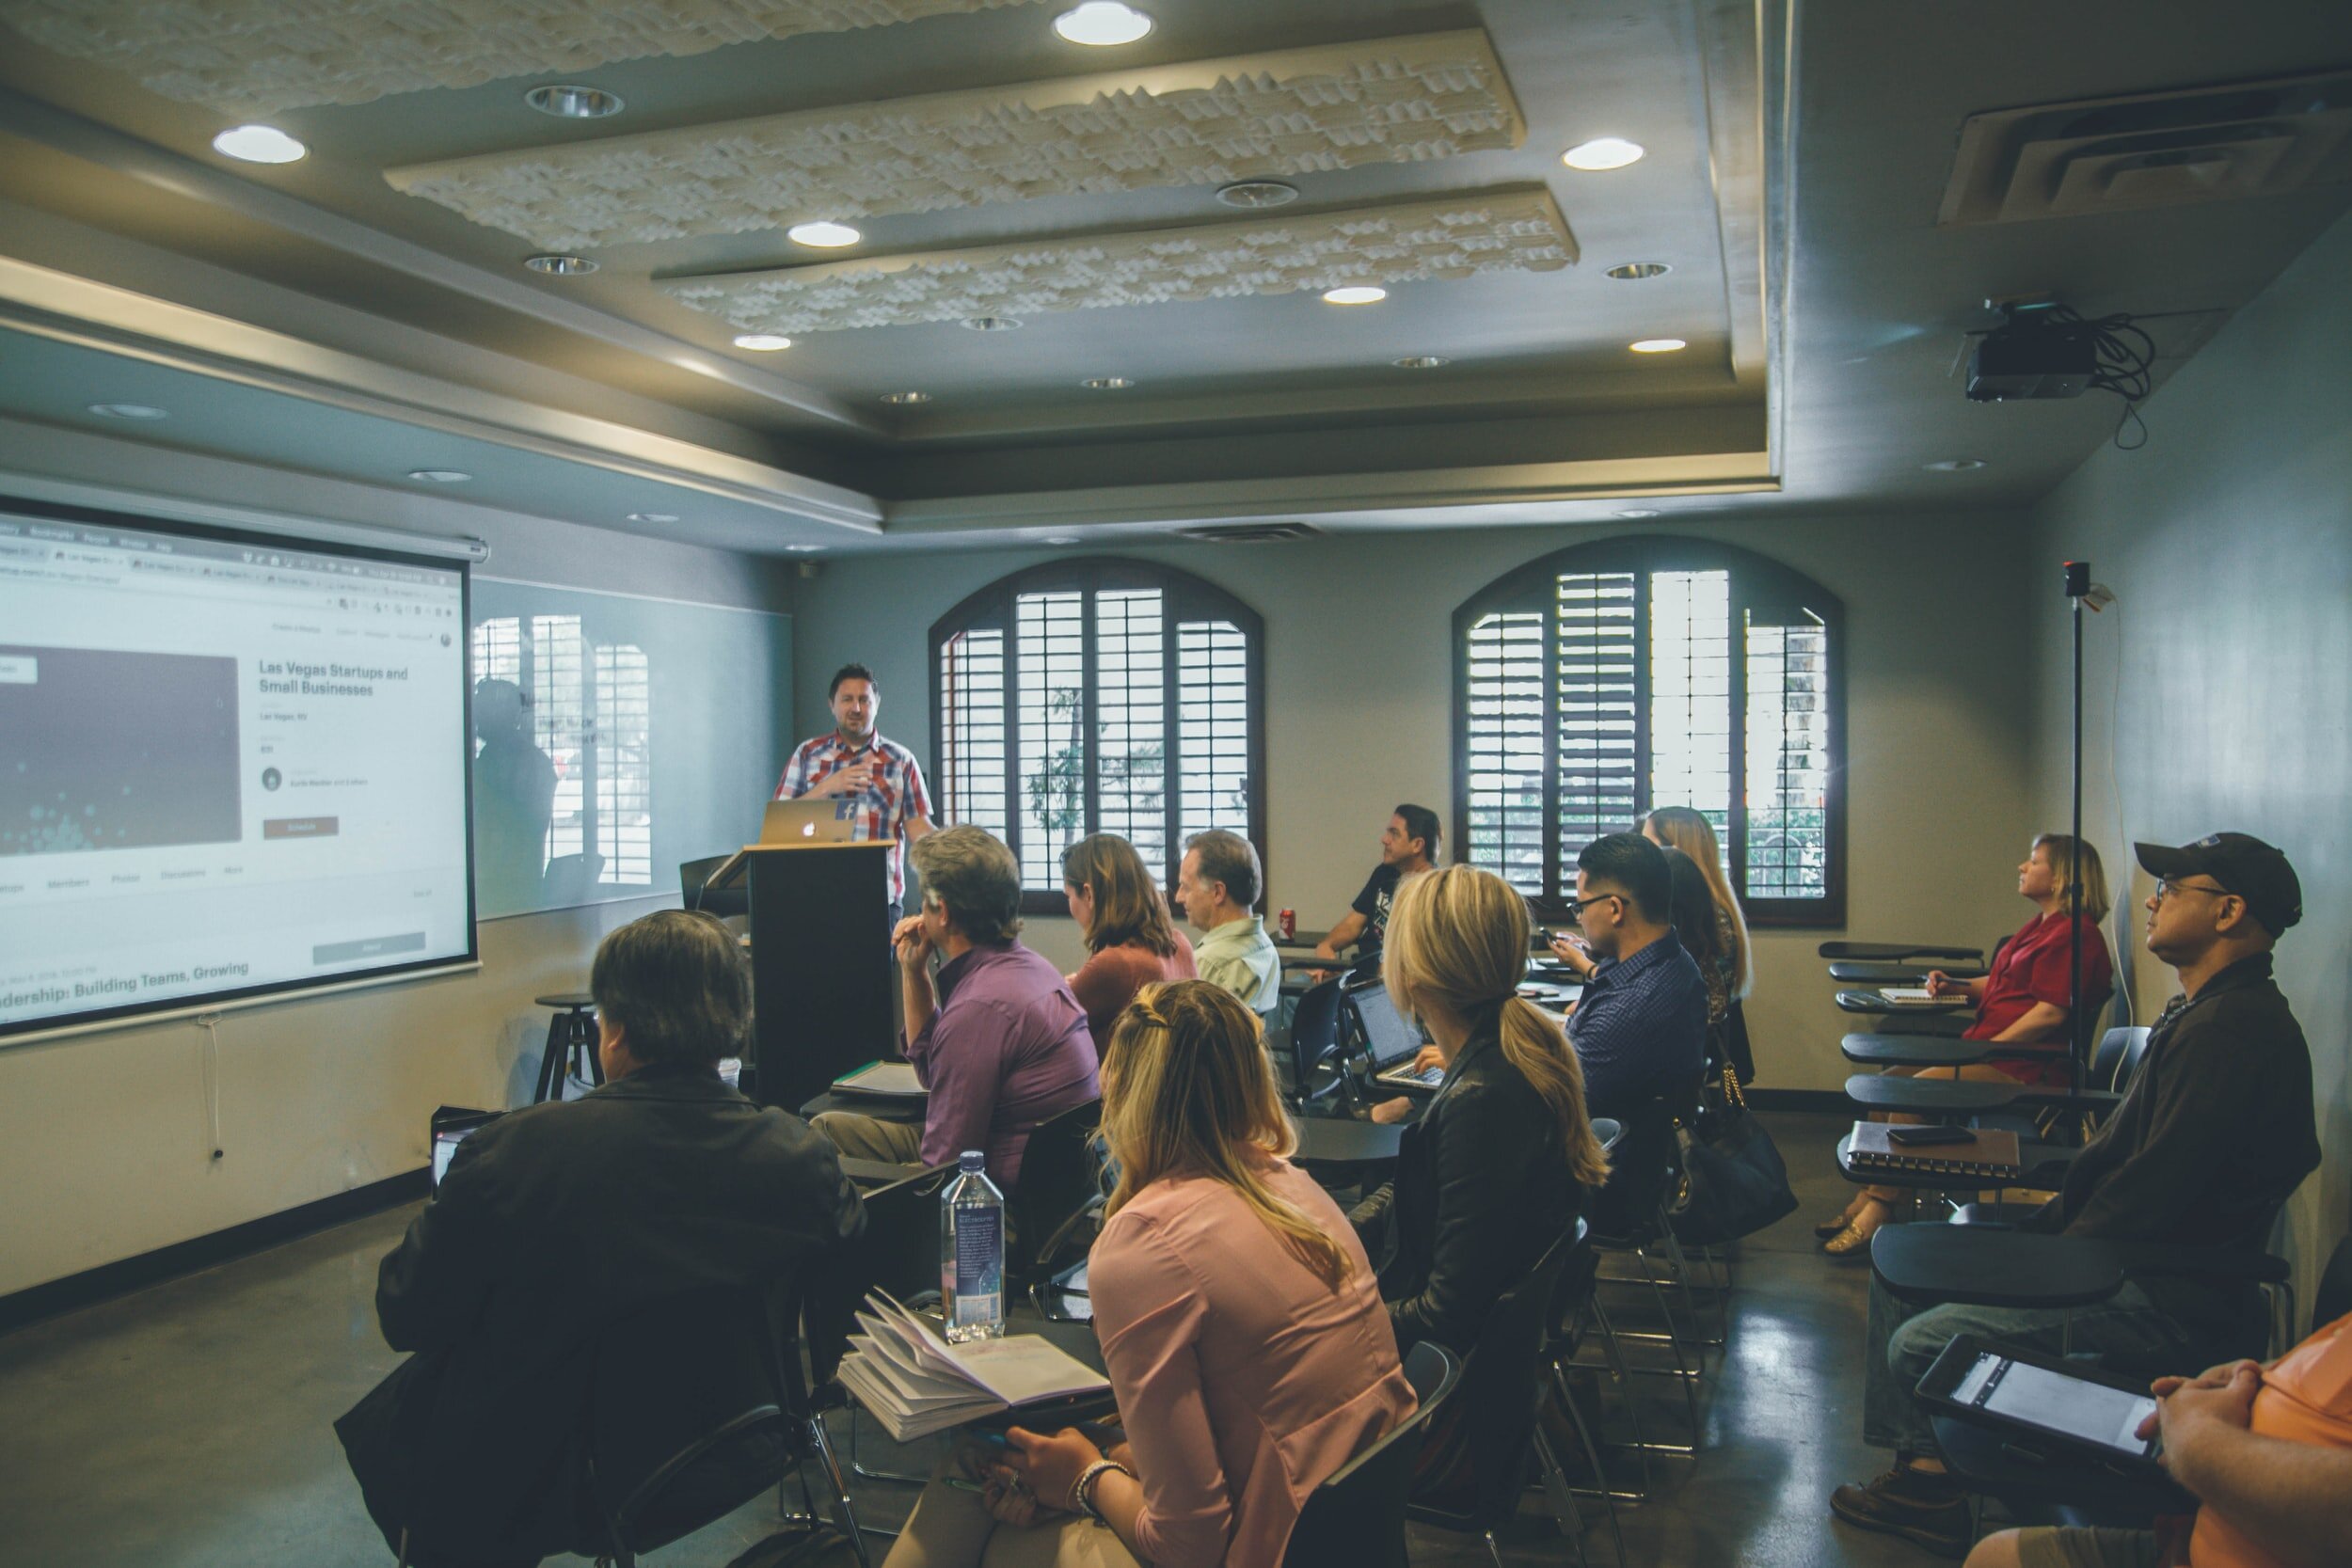
Instructional tips for teaching quantitative data analysis.

Tips for dealing with missing data from Dr. Stephen Gorard, author of How to Make Sense of Statistics.
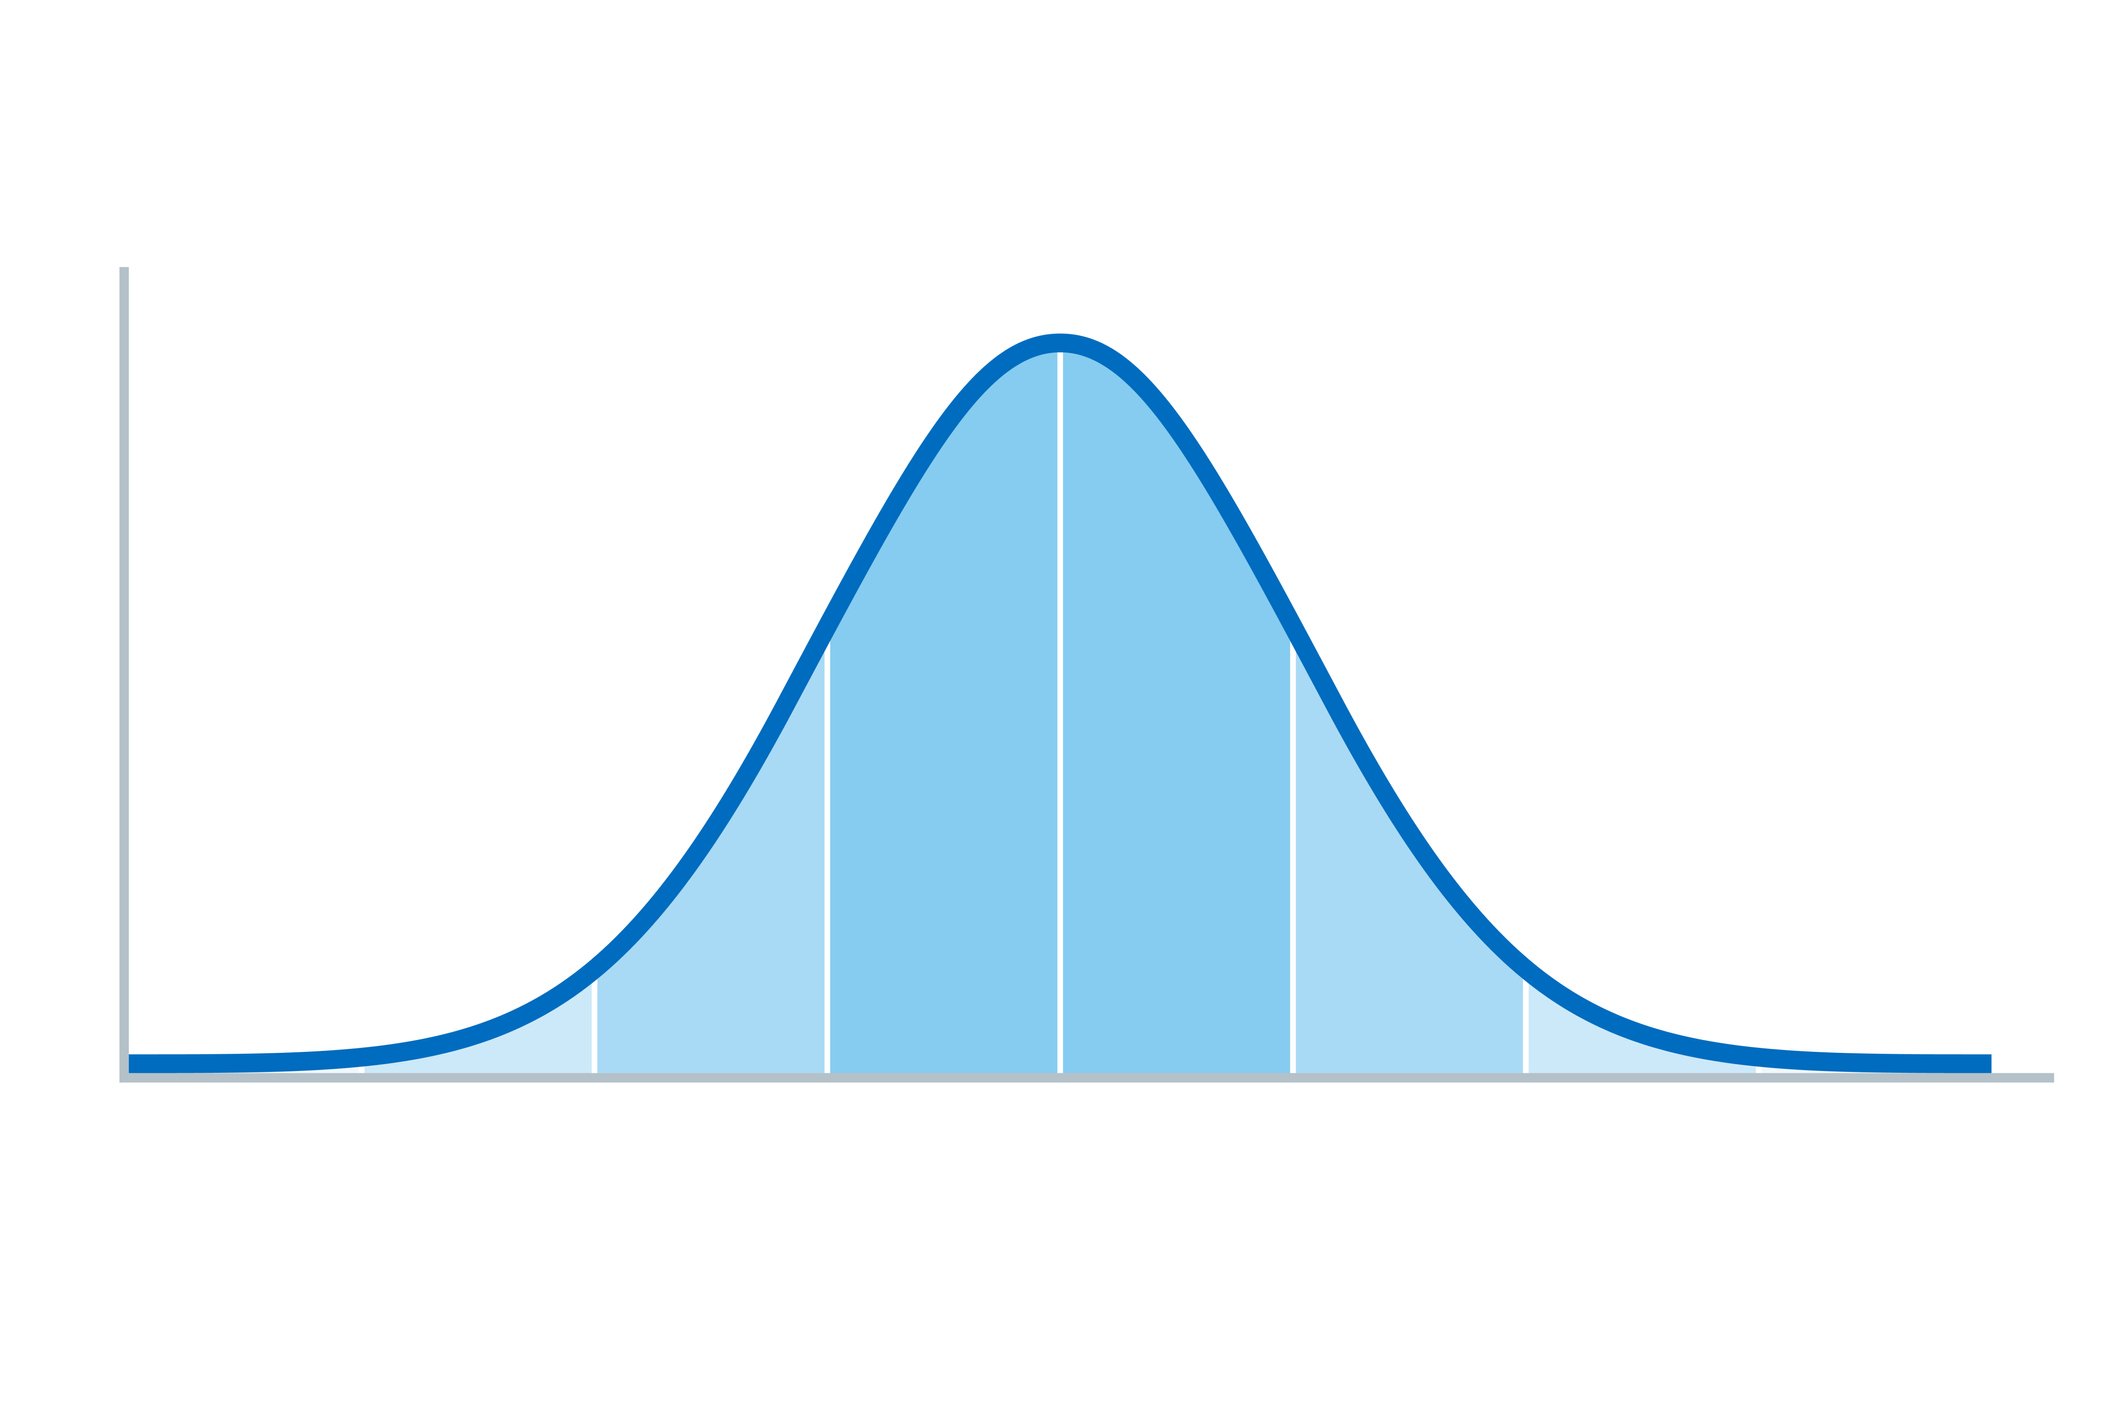
Learn more about standard deviation from a paper and presentation from Dr. Stephen Gorard.

How can you use Excel in your data analysis? Charlotte Brookfield explains!

Have you seen Dr. Gorard use card tricks to teach research methods? Watch this video!

Don’t have funds for data analysis software? Use Excel! Learn how in this interview with Charlotte Brookfield.


Professor Julie Scott Jones discusses lessons learned from teaching quantitative research methods online.

After 20 years of teaching research and quantitative methods to students in Political Science in the US, UK, and the EU, Dr. Loveless has developed a teaching method that has resulted in greater student success in statistics in each passing year

Mentor in Residence Stephen Gorard explains how to use population data.

Dr. Ann Sloan Devlin, author of The Research Experience, discusses first steps in data analysis for quantitative studies.

Want to use R for statistical analysis? These open-access resources might help!

Learn about R and find books about using this language and environment for statistical computing and graphics.


Throughout history humanity has had the urge to predict the future. The Greeks consulted the Delphi Oracle, whereas the Romans inspected sheep entrails and modern day sages poke around tea leaves to get the skinny on the future. This desire to predict the future has found its way into finance where modern day Haruspices pop up on television to make confident boasts about the future direction of the share du jour. All, but the very fortunate of these modern day prophets fail at their impossible task.
Tips with Diana


Simple but powerful, bar graphs are one of the most common charts used to compare categorical data, which are data that can be grouped into categories like race and sex. Here Diana gives some tips for making the perfect Bar graph.
Want to learn more about research with datasets? This curated collection of open-access articles can help you understand defining characteristics, and develop data literacy skills needed to work with large datasets and machine learning tools for managing Big Data sources.