Recent Advances in Partial Least Squares Structural Equation Modeling: Disclosing Necessary Conditions
by Joseph F. Hair, Jr. ,Marko Sarstedt, Christian M. Ringle and Siegfried P. Gudergan
See a previous post: Partial Least Squares Structural Equation Modeling: An Emerging Tool in Research.
Two Sage books are being recognized and cited at a rapidly increasing rate, and in combination recently exceeded 50,000 citations in a few short years. They also have been translated into eight languages (Arabic, French, German, Italian, Korean, Persian, Spanish, and Vietnamese) and will soon be available in Malay (forthcoming later this year). This success is the result of the rapid expansion in analytical extensions of the method of partial least squares structural equation modeling (PLS-SEM).
Necessary condition analysis (NCA)
Among the most recent options available in the dynamic landscape of emerging methodological extensions in the PLS-SEM field is the necessary condition analysis (NCA). In short, the merger of these two analytical methods provides researchers a comprehensive toolkit to explore the complex interrelationships between constructs and, at the same time, identify necessary conditions for specific outcomes. The NCA enables the identification of ‘must-have’ factors – those conditions which need to be met to achieve a certain outcome level. This necessity logic extends PLS-SEM’s sufficiency logic according to which each antecedent construct in a structural model is sufficient (but not necessary) for producing changes in the dependent construct. The figure below shows a PLS path model with its estimated relationships obtained by using the SmartPLS 4 software. For example, the results show the relationship from perceived quality (PERQ) to customer satisfaction (CUSA) is relatively strong. Based on PLS-SEM’s sufficiency logic, an increase in PERQ corresponds to a higher level of variance explained in the dependent construct CUSA.
Digging deeper, however, intuition tells us the “the more the better” perspective is just one side of the coin. For example, it is reasonable to assume a certain level of PERQ must be achieved to trigger CUSA in the first place. Similarly, achieving a high level of CUSA may not require maximizing PERQ. Analyzing this relationship with the NCA (e.g., via the SmartPLS 4 software,) produces a ceiling line (the grey line in the following figure labeled CR-FDH), which indicates the outcome level (y-axis) that can be achieved for a certain input (x-axis). For example, looking at the chart, we find that a CUSA level of 7 or higher can only be achieved for a PERQ value of at least 3.
Recent research provides guidelines for executing an NCA in a PLS-SEM, explaining relevant outputs such as the bottleneck table and the necessity effect size. Researchers have also suggested further extensions of the PLS-SEM-based NCA by combining its results with those from an importance-performance map analysis (IPMA), which adds a further dimension to the analysis. Specifically, the combined IPMA (cIPMA) ties together the structural model effects, the rescaled constructs’ scores, indicating their performance, and the NCA results. Related to our example above, researchers can use the cIPMA to identify satisfaction drivers, which have a strong effect on CUSA, are necessary, and whose performance is relatively low.
Learn more about partial least squares structural equation modeling
To get to know the PLS-SEM method, the third edition of A Primer on Partial Least Squares Structural Equation Modeling (PLS-SEM) by Joe Hair, Thomas Hult, Christian Ringle, and Marko Sarstedt, and the second edition of Advanced Issues in Partial Least Squares Structural Equation Modeling by Hair, Sarstedt, Ringle, and Siegfried Gudergan, are practical guides that provide researchers with a shortcut to fully understand and competently use the rapidly emerging multivariate PLS-SEM technique.
While the primer offers an introduction to fundamental topics such as establishing, estimating and evaluating PLS path models and some additional topics such as mediation and moderation, the book on advanced issues fully focuses on complementary analyses such as testing nonlinear relationships, latent class segmentation, multigroup analyses, measurement invariance assessment, and higher-order models. Featuring the latest research, examples analyzed with the SmartPLS 4 software, and expanded discussions throughout, these two books are designed to be easily understood by those want to exploit the analytical opportunities of PLS-SEM in research and practice. There is also an associated website for both books. Use the code COMMUNIT24 for a 25% discount when you order books from Sage, good until December 31, 2024.
Literature about the PLS-SEM method
Dul, J. (2016). Necessary Condition Analysis (NCA): Logic and Methodology of "Necessary but not Sufficient" Causality. Organizational Research Methods, 19(1), 10-52.
Dul, J. (2020). Conducting Necessary Condition Analysis. Sage.
Hair, J. F., Hult, G. T. M., Ringle, C. M., & Sarstedt, M. (2022). A Primer on Partial Least Squares Structural Equation Modeling (PLS-SEM) (3 ed.). Sage.
Hair, J. F., Sarstedt, M., Ringle, C. M., & Gudergan, S. P. (2024). Advanced Issues in Partial Least Squares Structural Equation Modeling (PLS-SEM) (2 ed.). Sage.
Hauff, S., Richter, N. F., Sarstedt, M., & Ringle, C. M. (2024). Importance and Performance in PLS-SEM and NCA: Introducing the Combined Importance-Performance Map Analysis (cIPMA). Journal of Retailing and Consumer Services, 78, 103723.
Richter, N. F., Hauff, S., Kolev, A. E., & Schubring, S. (2023). Dataset on an Extended Technology Acceptance Model: A Combined Application of PLS-SEM and NCA. Data in Brief, 48, 109190.
Richter, N. F., Schubring, S., Hauff, S., Ringle, C. M., & Sarstedt, M. (2020). When Predictors of Outcomes are Necessary: Guidelines for the Combined use of PLS-SEM and NCA. Industrial Management & Data Systems, 120(12), 2243-2267.
Sage Research Methods Community posts about quantitative data analysis
Learn about options available in the dynamic landscape of emerging methodological extensions in the PLS-SEM field is the necessary condition analysis (NCA).
Dr. Stephen Gorard defines and explains randomness in a research context.
Mentor in Residence Stephen Gorard explains how researchers can think about predicting results.
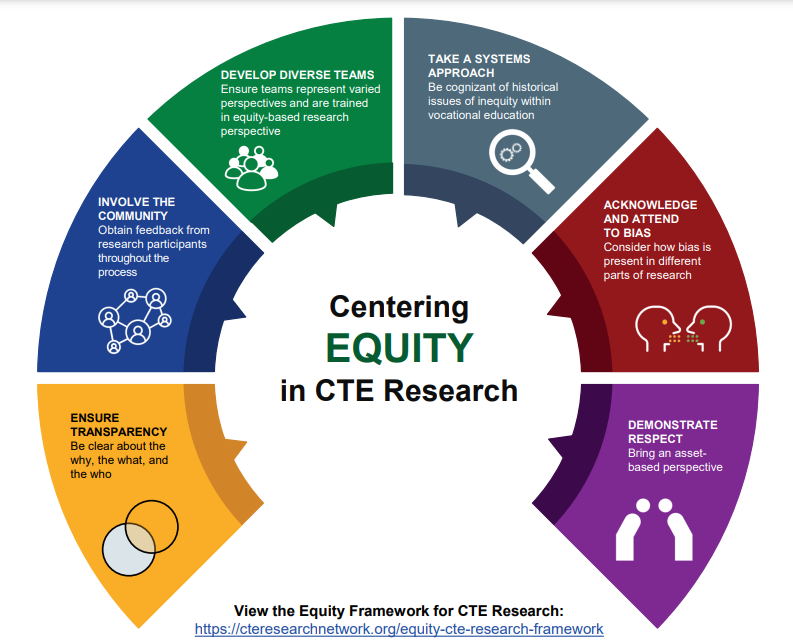
The Career and Technical Education (CTE) Equity Framework approach draws high-level insights from this body of work to inform equity in data analysis that can apply to groups of people who may face systemic barriers to CTE participation. Learn more in this two-part post!
The Career and Technical Education (CTE) Equity Framework approach draws high-level insights from this body of work to inform equity in data analysis that can apply to groups of people who may face systemic barriers to CTE participation. This is part 2, find the link to part 1 and previous posts about the Equity Framework.
In an era of rampant misinformation and disinformation, what research can you trust? Dr. Stephen Gorard offers guidance!
Images contain information absent in text, and this extra information presents opportunities and challenges. It is an opportunity because one image can document variables with which text sources (newspaper articles, speeches or legislative documents) struggle or on datasets too large to feasibly code manually. Learn how to overcome the challenges.
Tips for dealing with missing data from Dr. Stephen Gorard, author of How to Make Sense of Statistics.
Learn more about standard deviation from a paper and presentation from Dr. Stephen Gorard.
This collection of open-access articles includes quantitative examples of analysis for video data.
Whether you call it ‘content analysis’, ‘textual data labeling’, ‘hand-coding’, or ‘tagging’, a lot more researchers and data science teams are starting up annotation projects these days. Learn how to avoid potential pitfalls.
Listen to Dr. Stephen Gorard discuss his no-nonsense approach to statistics.
Want to learn more about research with datasets? This curated collection of open-access articles can help you understand defining characteristics, and develop data literacy skills needed to work with large datasets and machine learning tools for managing Big Data sources.
Professor Julie Scott Jones discusses lessons learned from teaching quantitative research methods online.
After 20 years of teaching research and quantitative methods to students in Political Science in the US, UK, and the EU, Dr. Loveless has developed a teaching method that has resulted in greater student success in statistics in each passing year
Mentor in Residence Stephen Gorard explains how to use population data.
Find open-access instructional materials and articles about teaching how to use regression analysis methods.
Dr. Ann Sloan Devlin, author of The Research Experience, discusses first steps in data analysis for quantitative studies.
Want to use R for statistical analysis? These open-access resources might help!
Learn about R and find books about using this language and environment for statistical computing and graphics.
An interview with authors of Social Statistics for a Diverse Society, who discuss how to use statistical techniques to understand pressing social issues.
Want to learn about Big Data analysis? Here are some open-access examples.
How can you collect and analyze text you find online?
Big Data = Big Topic. Start with the basics!
In the day-to-day of political communication, politicians constantly decide how to amplify or constrain emotional expression, in service of signalling policy priorities or persuading colleagues and voters. We propose a new method for quantifying emotionality in politics using the transcribed text of politicians’ speeches. This new approach, described in more detail below, uses computational linguistics tools and can be validated against human judgments of emotionality.
Institutions — rules that govern behavior — are among the most important social artifacts of society. So it should come as a great shock that we still understand them so poorly. How are institutions designed? What makes institutions work? Is there a way to systematically compare the language of different institutions? One recent advance is bringing us closer to making these questions quantitatively approachable. The Institutional Grammar (IG) 2.0 is an analytical approach, drawn directly from classic work by Nobel Laureate Elinor Ostrom, that is providing the foundation for computational representations of institutions. IG 2.0 is a formalism for translating between human-language outputs — policies, rules, laws, decisions, and the like. It defines abstract structures precisely enough to be manipulable by computer. Recent work, supported by the National Science Foundation (RCN: Coordinating and Advancing Analytical Approaches for Policy Design & GCR: Collaborative Research: Jumpstarting Successful Open-Source Software Projects With Evidence-Based Rules and Structures ), leveraging recent advances in natural language processing highlighted on this blog, is vastly accelerating the rate and quality of computational translations of written rules.
In the field of artificial intelligence (AI), Transformers have revolutionized language analysis. Never before has a new technology universally improved the benchmarks of nearly all language processing tasks: e.g., general language understanding, question - answering, and Web search. The transformer method itself, which probabilistically models words in their context (i.e. “language modeling”), was introduced in 2017 and the first large-scale pre-trained general purpose transformer, BERT, was released open source from Google in 2018. Since then, BERT has been followed by a wave of new transformer models including GPT, RoBERTa, DistilBERT, XLNet, Transformer-XL, CamemBERT, XLM-RoBERTa, etc. The text package makes all of these language models and many more easily accessible to use for R-users; and includes functions optimized for human-level analyses tailored to social scientists.
There’s a validity problem with automated content analysis. In this post, Dr. Chung-hong Chan introduces a new tool that provides a set of simple and standardized tests for frequently used text analytic tools and gives examples of validity tests you can apply to your research right away.
My journey into text mining started when the institute of Digital Humanities (DH) at the University of Leipzig invited students from other disciplines to take part in their introductory course. I was enrolled in a sociology degree at the time, and this component of data science was not part of the classic curriculum; however, I could explore other departments through course electives and the DH course sounded like the perfect fit.
Find tips to help you share your research and numerical findings.