Sage Books about Quantitative Data Analysis with R
By Janet Salmons, Ph.D., Research Community Manager for Sage Methodspace
What is R?
The R Foundation is a nonprofit organization that supports the development of R and other innovations in statistical computing. According to their website:
R is a language and environment for statistical computing and graphics. It is a GNU project which is similar to the S language and environment which was developed at Bell Laboratories (formerly AT&T, now Lucent Technologies) by John Chambers and colleagues. R can be considered as a different implementation of S. There are some important differences, but much code written for S runs unaltered under R.
R provides a wide variety of statistical (linear and nonlinear modelling, classical statistical tests, time-series analysis, classification, clustering, …) and graphical techniques, and is highly extensible. The S language is often the vehicle of choice for research in statistical methodology, and R provides an Open Source route to participation in that activity.
One of R’s strengths is the ease with which well-designed publication-quality plots can be produced, including mathematical symbols and formulae where needed. Great care has been taken over the defaults for the minor design choices in graphics, but the user retains full control.
R is an integrated suite of software facilities for data manipulation, calculation and graphical display. R is available as Free Software under the terms of the Free Software Foundation’s GNU General Public License in source code form. It compiles and runs on a wide variety of UNIX platforms and similar systems (including FreeBSD and Linux), Windows and MacOS. It includes
an effective data handling and storage facility,
a suite of operators for calculations on arrays, in particular matrices,
a large, coherent, integrated collection of intermediate tools for data analysis,
graphical facilities for data analysis and display either on-screen or on hardcopy, and
a well-developed, simple and effective programming language which includes conditionals, loops, user-defined recursive functions and input and output facilities.
Sage authors have written a number of books about using R in social science data analysis and data visualization. If you would like to purchase one of these books use the code MSPACEQ423 for a 20% discount on a purchase of the book, through December 31, 2023.
Books to help you use R in your research
Doing Data Science in R: An Introduction for Social Scientists by Mark Andrews (2021)
This approachable introduction to doing data science in R provides step-by-step advice on using the tools and statistical methods to carry out data analysis. Introducing the fundamentals of data science and R before moving into more advanced topics like Multilevel Models and Probabilistic Modelling with Stan, it builds knowledge and skills gradually.
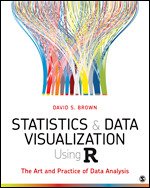
Statistics and Data Visualization Using R: The Art and Practice of Data Analysis by David S. Brown (2021)
Designed to introduce students to quantitative methods in a way that can be applied to all kinds of data in all kinds of situations, Statistics and Data Visualization Using R: The Art and Practice of Data Analysis by David S. Brown teaches students statistics through charts, graphs, and displays of data that help students develop intuition around statistics as well as data visualization skills. By focusing on the visual nature of statistics instead of mathematical proofs and derivations, students can see the relationships between variables that are the foundation of quantitative analysis. Using the latest tools in R and R RStudio® for calculations and data visualization, students learn valuable skills they can take with them into a variety of future careers in the public sector, the private sector, or academia. Starting at the most basic introduction to data and going through most crucial statistical methods, this introductory textbook quickly gets students new to statistics up to speed running analyses and interpreting data from social science research.
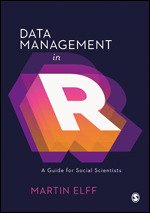
Data Management in R: A Guide for Social Scientists by Martin Elff (2021)
An invaluable, step-by-step guide to data management in R for social science researchers. This book shows students how to recode data, combine data from different sources, document data, and import data from statistical packages other than R. It explores both qualitative and quantitative data and is packed with a range of supportive learning features such as code examples, overview boxes, images, tables, and diagrams.
Quantitative Social Science Data with R: An Introduction, Second Edition by Brian J. Fogarty (2023)
Relevant, engaging, and packed with student-focused learning features, this book provides the basic step-by-step introduction to quantitative research and data every student needs. Gradually introducing applied statistics and the language and functionality of R and R Studio software, it uses examples from across the social sciences to show students how to apply abstract statistical and methodological principles to their own work.
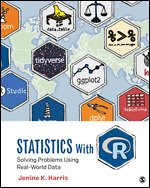
Statistics With R: Solving Problems Using Real-World Data by Jenine K. Harris (2020)
Drawing on examples from across the social and behavioral sciences, Statistics with R: Solving Problems Using Real-World Data introduces foundational statistics concepts with beginner-friendly R programming in an exploration of the world’s tricky problems faced by the “R Team” characters. Inspired by the programming group “R Ladies,” the R Team works together to master the skills of statistical analysis and data visualization to untangle real-world, messy data using R. The storylines draw students into investigating contemporary issues such as marijuana legalization, voter registration, and the opioid epidemic, and lead them step-by-step through full-color illustrations of R statistics and interactive exercises.
Statistical Inference and Probability by John MacInnes (2022)
An experienced author in the field of data analytics and statistics, John Macinnes has produced a straight-forward text that breaks down the complex topic of inferential statistics with accessible language and detailed examples.
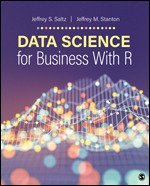
Data Science for Business With R by Jeffrey S. Saltz, Jeffrey M. Stanton (2021)
Data Science for Business with R, written by Jeffrey S. Saltz and Jeffrey M. Stanton, focuses on the concepts foundational for students starting a business analytics or data science degree program. Designed for students with little to no experience in related areas like computer science, the book chapters follow a logical order from introduction and installation of R and RStudio, working with data architecture, undertaking data collection, performing data analysis, and transitioning to data archiving and presentation. (Also see An Introduction to Data Science (2017) by the same authors.)
Statistics with R: A Beginner's Guide, Second Edition by Robert Stinerock (2023)
Statistics is made simple with this award-winning guide to using R and applied statistical methods. With a clear step-by-step approach explained using real world examples, learn the practical skills you need to use statistical methods in your research from an expert with over 30 years of teaching experience. With a wealth of hands-on exercises and online resources created by the author, practice your skills using the data sets and R scripts from the book with detailed screencasts that accompany each script.








Looking back at 2023, find all posts here!
We explored stages of a research project, from concept to publication. In each quarter we focused on one part of the process. In this recap for the year you will find original guest posts, interviews, curated collections of open-access resources, recordings from webinars or roundtable discussions, and instructional resources.